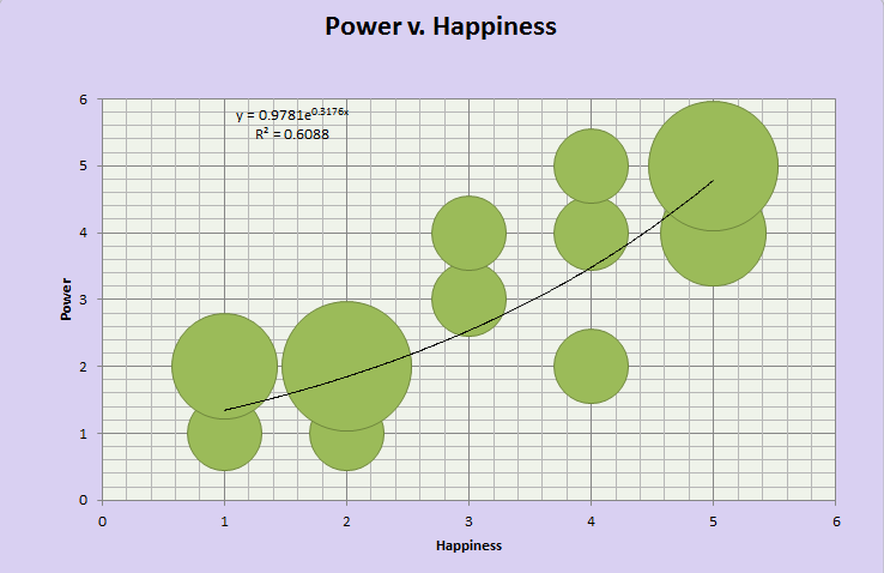
The graph above is a weighted graph. The size of each circle is proportional to the number of hits for that particular data point. For instance, at Happiness 1, Power 1, there was 1 hit. At Happiness 1, Power 2, there were 2 hits, and so the radius of the circle at H1, P2 is twice the size of the circle at H1, P1. The trend line of this graph is y=.9871e^0.3176x with an R^2 value of 0.6088.
The Point:
The R^2 value proves that a correlation exists between power and happiness. R^2 is a measure of "fittedness" of the trend line. R^2 varies between 0 and 1, 1 being an exact fit. Because the R^2 value for this trend line is above 0.5, there is a correlation between power and happiness. The correlation between happiness and power is an important part of human nature outside of Saturday; the more in control you are, the happier you feel. For example, if you are doing a project and feel good about it, chances are that you also feel in control of your contribution towards the project.
